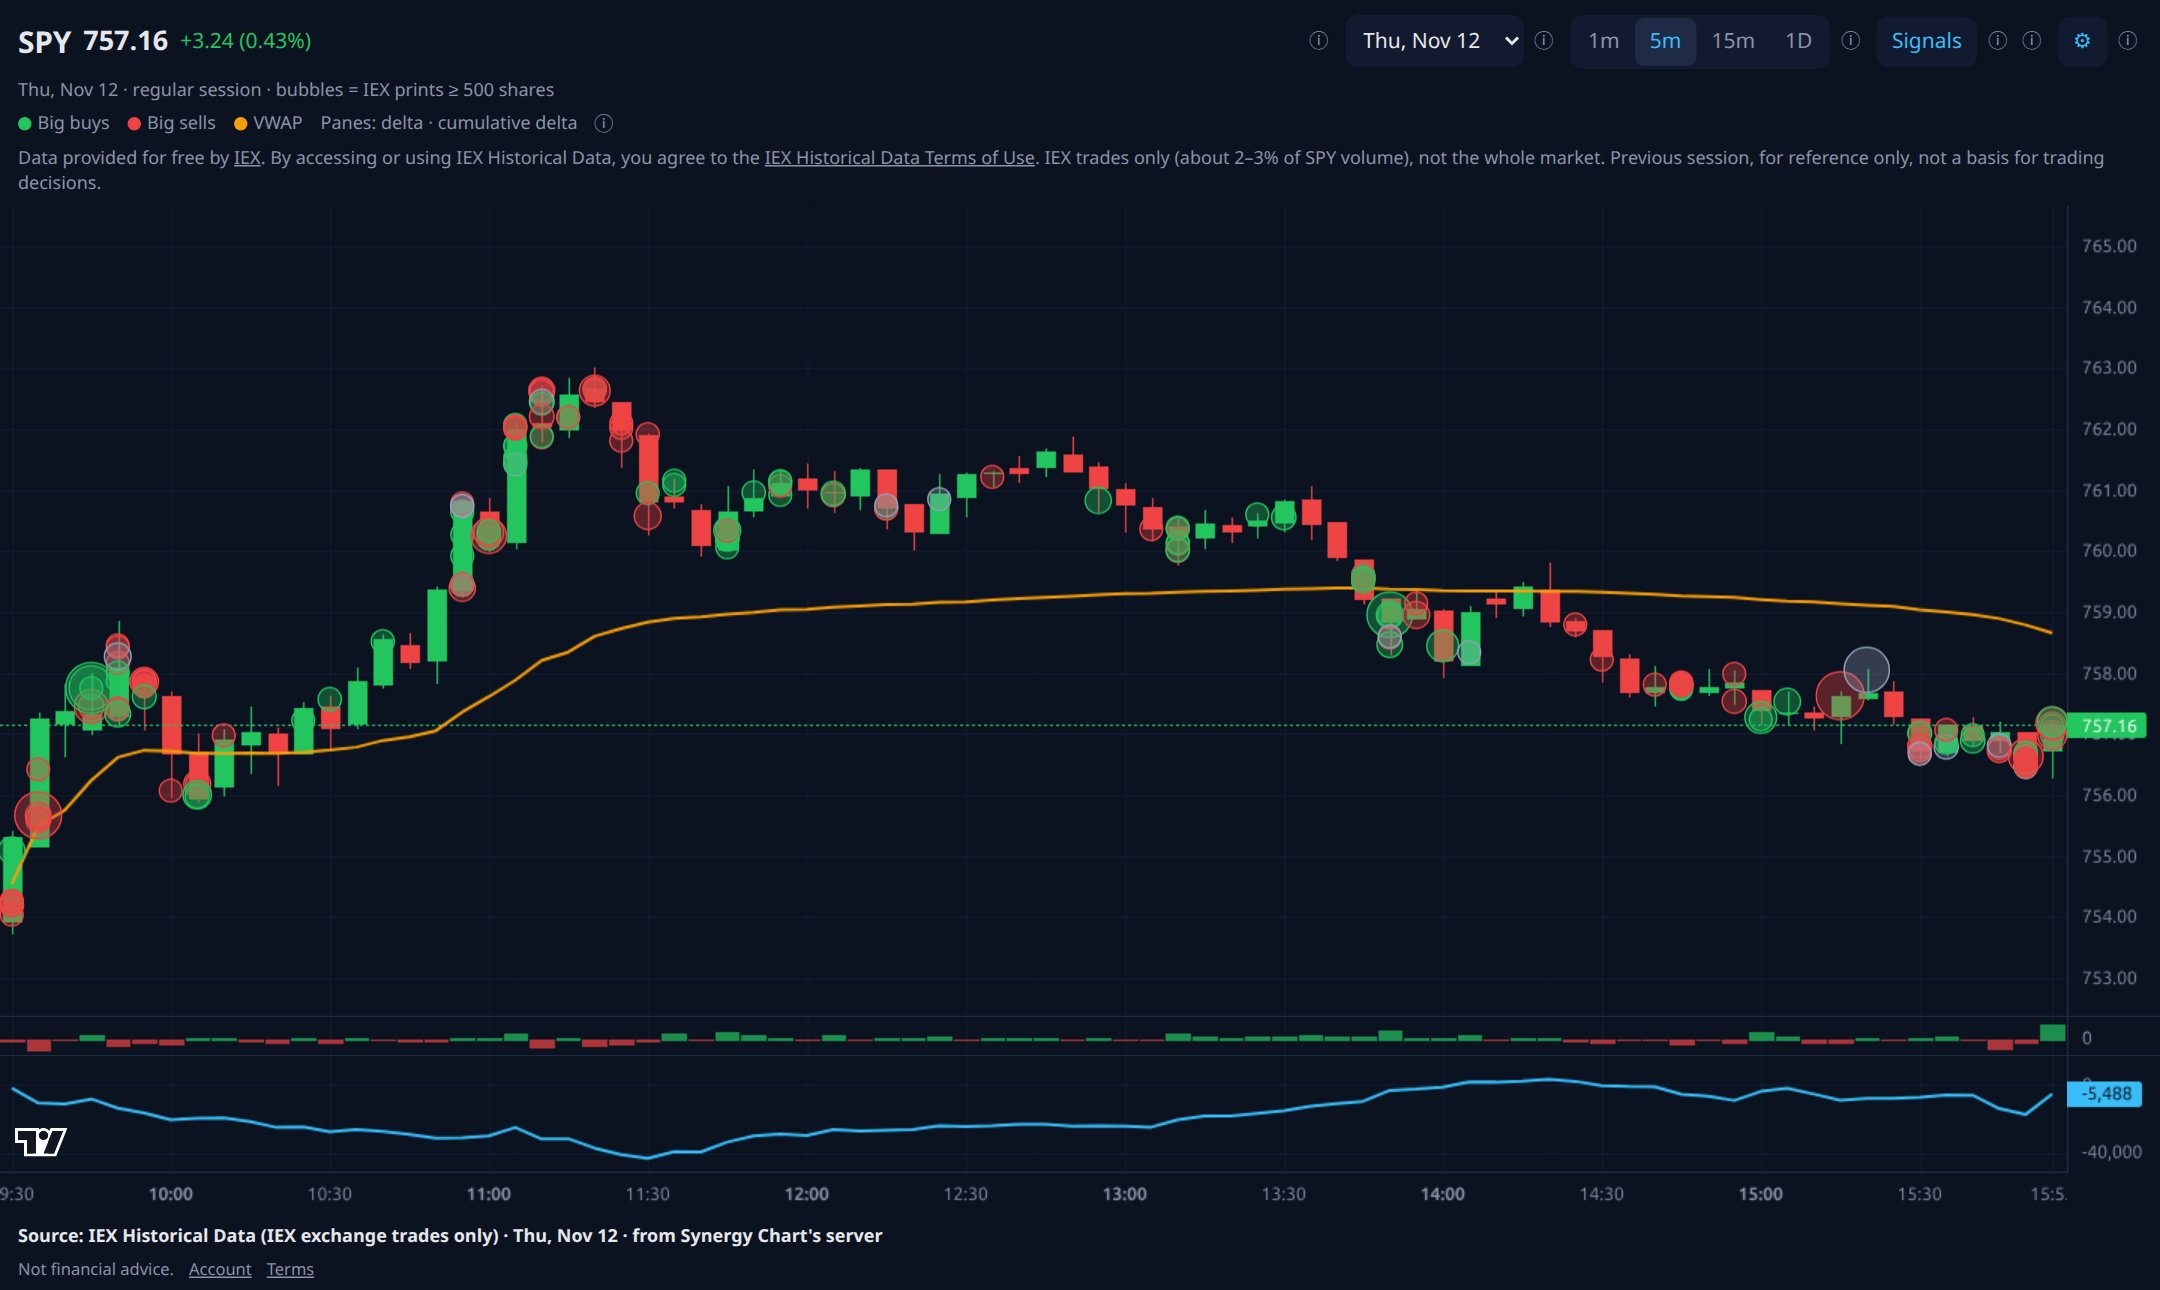
Synergy Chart draws the biggest SPY trades as bubbles at the exact price they happened, green for buyers and red for sellers, with delta and cumulative delta underneath. Plus Synergy Signals, a free daily setup list with the rules shown.

Candles tell you where price went. The bubbles show where the size traded and who was pushing.
The largest SPY prints drawn where they happened, sized by trade size: green when a buyer hit the ask, red when a seller hit the bid.
Buy minus sell volume for every bar, and that pressure added up over the session, so you see when it turns against price. VWAP too.
Chart markers from named rule sets (Tarzan, Atlas, Rebound, Snapback and more) on the candles you're looking at. Included in the trial.
SPY only. Uses your own free Alpaca data key (all exchanges, 15 minutes delayed); ten sample sessions are built in.
A new daily signals service, free for now. After every close we list the large US stocks with a sharp short-term dip (RSI 2 under 10) inside a long-term uptrend that at least 3 of 4 fair-value methods call undervalued. Rules in full, no black box.
See today's signalsSignals, not advice. The RSI-2 dip rule has a real per-trade edge in our S&P 500 test but hasn't beaten holding the index since 2009; the fair-value filter on top is untested, so we track it forward and quote no win rate.
We test popular strategies from YouTube, courses and template sites the same way every time: realistic costs, the same trade taken at random times for comparison, and a look-ahead check. Most fail. We publish the verdicts.
Read the research